| Monthly India Treasury Update |
| Wednesday, 1 May 2013 |
| |
| Seek truth from facts ~ Deng Xiaoping |
| |
| This report must be read with the disclosures at the conclusion of the report. |
| |
| Domestic Markets |
| |
| Rupee ended higher on lower commodity prices and expectations of improvement in current account deficit |
|
|
 |
April Closing Rate – 53.80/53.81 (previous month close – 54.31/54.32) |
|
|
|
After touching a high of 54.89 at the start of the month, rupee strengthened against the USD as the correction in commodity prices globally led to expectations of an improvement going forward as regards the current account deficit. Better than expected trade data for March led to further gains. Continued FII inflows supported the move. Rate cut hopes and resultant gains in the equities towards the end of the month added to the INR strength |
|
| |
| Indian Equity Markets ended higher on increased expectations of rate cut; led by interest rate sensitive sectors |
|
|
|
BSE index April closing– 18,835.77 (up 3.55% from March close) |
|
|
|
Indian Equity Markets closed higher for the month as a lower than expected WPI inflation number along with good trade data increased hopes of a rate cut by the central bank. A price correction in Oil and Gold also helped build expectations of improvement in current account deficit thereby giving the central bank more space to cut rates. Global cues too added to the positive sentiment |
|
|
|
FII Equity flows April: Net USD + 1,183.45 MIO investment |
|
| |
| Indian Bonds Market ended higher on increased expectations of rate cut |
|
|
|
8.15 percent Government bond 2022 yield – 7.7300 percent (down 22 bps over previous month close of 7.9500 percent) |
|
|
|
Indian Bonds rallied after better than expected inflation data and good trade numbers increased the hopes for a rate cut |
|
|
|
FII Debt flows April: Net USD + 1,287.58 MIO investment |
|
| |
| Key Local Policy Initiatives and Government Actions |
|
|
|
RBI delivered a 25 bps rate cut in the key policy rate |
|
|
|
Finance minister presented the amendments to the finance bill wherein: |
|
|
|
| 1. |
Reduced withholding tax from 20% to 5% on interest payments to foreign investors in
respect of investments in government and infrastructure bonds during 1 June 2013
and 31 May 2015 |
|
|
| 2. |
Acceptance of TRC (tax residency certificate) issued by foreign government for tax benefit under DTAs |
|
|
| 3. |
Trading in commodity derivatives no more a speculative transaction |
|
|
|
|
| |
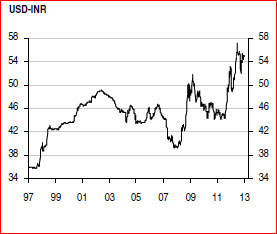
Snapshot from HSBC Currency Outlook (source HSBC Research; Currency outlook
April 2013) |
|
|
| Source: Bloomberg |
|
| India: Weighed by the current account deficit |
|
|
The INR faces strong headwinds from India's current account deficit. The Q4 2012 BoP data revealed that the current account deficit reached another record level of 6.7% of GDP, driven by the large trade deficit, amid strong oil and gold demand. Despite strong net services and transfer inflows, and the ongoing curb on gold imports in addition to the gradual removal of fuel subsidies, the deficit will still be sizeable in 2013. This will make it difficult for the INR to appreciate in a sustained manner |
|
|
|
With the still sizeable current account deficit, India will continue to depend on portfolio inflows and external commercial borrowings to provide inflows. This was the case in 2012 and 2013, is expected to be similar. In the medium term, India needs to take bolder actions to bring
down the trade deficit and also further loosen the regulatory requirements to allow more FDI into India. Despite these challenges we remain slightly on the optimistic side that INR will slowly recover |
|
|
| Currency Forecast |
|
| |
2012 |
|
2013 |
|
|
|
2014 |
|
| Currency |
Q3 |
Q4 |
Q1 |
Q2f |
Q3f |
Q4f |
Q1f |
Q2f |
| USD/INR |
52.90 |
55.00 |
54.30 |
54.00 |
53.00 |
52.00 |
52.00 |
52.00 |
| EUR/USD |
1.29 |
1.32 |
1.28 |
1.32 |
1.34 |
1.35 |
1.37 |
1.37 |
| GBP/USD |
1.61 |
1.63 |
1.52 |
1.50 |
1.49 |
1.48 |
1.46 |
1.46 |
|
|
|
| Source: HSBC April 2013 Currency Outlook |
| |
| Indicative Rates |
|
| Indian Rupee |
As on
Apr. end |
As on
Mar. end |
Change |
Asian Indices |
As on
Apr. end |
As on
Mar. end |
Change |
| USD/INR |
53.8 |
54.31 |
-0.94% |
BSE Sensex |
19,504.18 |
18,835.77 |
3.55% |
| EUR/INR |
79.675 |
69.57 |
14.52% |
US Treasuries |
|
|
|
| JPY/INR |
0.5509 |
0.5759 |
-4.34% |
1 year |
0.1034 |
0.129 |
-19.84% |
| GBP/INR |
83.37 |
82.53 |
1.02% |
5 years |
0.6776 |
0.7691 |
-11.90% |
| CHF/INR |
57.78 |
57.16 |
1.08% |
10 years |
1.6734 |
1.8521 |
-9.65% |
| AUD/INR |
55.66 |
56.43 |
-1.36% |
Commodity |
|
|
|
| Global Indices |
|
|
|
Gold |
1,476.6 |
1,596.17 |
-7.49% |
| Dow Jones Index |
14,840 |
14,578.54 |
1.79% |
Silver |
24.28 |
28.26 |
-14.08% |
| GOI Bonds |
|
|
|
Crude Oil |
102.37 |
110.02 |
-6.95% |
| 1 year |
7.5 |
7.82 |
-4.09% |
USD/INR Forwards |
|
|
|
| 5 years |
7.55 |
7.96 |
-5.15% |
6 months(%) |
6.80% |
7.23% |
-5.91% |
| 10 years |
7.73 |
7.95 |
-2.77% |
1 year(%) |
6.42% |
6.70% |
-4.15% |
| 6 Months LIBOR |
|
|
|
|
|
|
|
| USD |
0.4254 |
0.4449 |
-4.38% |
|
|
|
|
|
|
|
| Source: Bloomberg/Reuters |
| |
Indian Macro-economic Indicators released (period 1 April 2013
to 31 April 2013) |
|
| Date |
Time |
Indicator |
Period |
Actual |
Forecast |
Prior |
| 18-Apr-2013 |
11:00 |
Exports Y-O-Y% |
Mar |
7.0% |
- |
4.2% |
| 18-Apr-2013 |
11:00 |
Imports Y-O-Y% |
Mar |
-2.9% |
- |
2.6% |
| 12-Apr-2013 |
11:00 |
Industrial Production Y-O-Y% |
Feb |
0.6% |
-1.3% |
2.4% |
| 12-Apr-2013 |
11:00 |
CPI Y-O-Y% |
Mar |
10.39% |
10.70% |
10.91% |
| 15-Apr- 2013 |
11:00 |
WPI Y-O-Y% |
Mar |
5.96% |
6.27% |
6.84% |
|
|
| Source: Bloomberg/Reuters |
|