| Monthly India Treasury Update |
| Friday, 1 February 2013 |
| |
"You haven’t achieved equality until you’re a legitimate target for humour."
― Scott Adams |
| |
| This report must be read with the disclosures at the conclusion of the report |
| |
| Domestic Markets |
| |
| Rupee ended higher on global risk on sentiments and local reforms |
|
|
 |
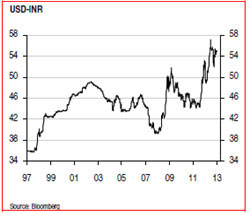
January Closing Rate – 53.23/53.24 (previous month closing - 54.99/55.00). |
|
|
|
Rupee strengthened in January, starting on a positive note, as the US congress reached a deal on the fiscal cliff which helped global
investor sentiment. Locally, the government pressed ahead with market and fiscal reforms, partially deregulating diesel prices thereby taking a major step towards checking the
fiscal deficit. Good inflows from FIIs, throughout the month, kept up the momentum even though dollar demand from oil companies was robust. The government disinvestment programme
also kicked off which supported the rupee. |
|
| |
Indian Equity Markets ended higher amidst global risk on sentiments and
RBI policy rate cut announcement
|
|
|
|
BSE index January closing – 19,894.98 (Up 2.41% from December closing). |
|
|
|
Indian Equity Markets traded higher over the month amid global risk on sentiments. The first major move came on increased expectations of
a policy rate cut, as inflation data came in lower than expected. The fiscal correction measures also aided the move to a large extent. Good buying interest from FIIs continued, in
a similar trend to 2012. |
|
|
|
FII Equity flows January: Net USD +4095.80 MIO investment. |
|
| |
| Indian Bonds Market ended higher on low supply of issuances and the policy rate cut by RBI |
|
|
|
8.15 percent Government bond 2022 yield – 7.9100 percent (down 14 bps over previous month close of 8.0500 percent). |
|
|
|
Indian Bonds ended higher for the month amidst a low supply of government issuances and policy rate cut announcement by the RBI. |
|
|
|
FII Debt flows January: Net USD +614.27 MIO investment. |
|
| |
| Key Local Policy Initiatives and Government Actions |
|
|
|
RBI cut the repo/reverse repo rates by 25 bps to 7.75% and 8.75% respectively and cut the CRR by 25 bps from 4.25% to 4.00%. |
|
|
|
Pushing ahead with reforms, government deregulated diesel prices, leaving the decision of partial price increases to oil marketing
companies. |
|
|
|
Finance ministry has decided to raise the limit of FII investment in Government bonds from
10 Bn USD to 15 Bn USD, in Corporate bonds
from 20 Bn USD to 25 Bn USD and remove the lock in period of 1 year in the infrastructure bonds. |
|
| |
| Snapshot from HSBC Global Economics |
|
|
| India - politics still the issue |
|
|
We have previously acknowledged, that despite the announced reforms by the government to tackle its fiscal deficit and attract investor
inflows, political risks remained. This has been evident during the winter session of parliament. However, recent developments to pass the Retail FDI bill suggest that the reform
process may be gaining greater traction. |
|
|
|
While there are still many hurdles for the INR to overcome, we retain the view that ongoing reforms will be seen in coming months to help
improve the investment outlook onshore and
to contain the wide current account and fiscal deficits. |
|
|
|
In the case that reforms take a step backwards, downward pressure on the INR would unfold. However, in this case we would expect the RBI to
step in, as it has done in the past to limit INR weakness. This should limit the topside in USD-INR to some degree, and as such we retain a relatively bullish forecast for the
INR into 2013. |
|
|
| Source: HSBC January 2013 Currency Outlook |
| |
| Currency Forecast |
|
| |
2012 |
|
|
|
2013 |
|
|
|
| Currency |
Q1 |
Q2 |
Q3 |
Q4f |
Q1f |
Q2f |
Q3f |
Q4f |
| USD/INR |
50.90 |
55.50 |
52.90 |
55.00 |
53.00 |
52.00 |
51.00 |
50.00 |
| EUR/USD |
1.33 |
1.27 |
1.29 |
1.32 |
1.34 |
1.34 |
1.35 |
1.35 |
| GBP/USD |
1.6 |
1.57 |
1.61 |
1.63 |
1.60 |
1.56 |
1.53 |
1.52 |
|
|
|
| Source: HSBC January 2013 Currency Outlook |
| |
| Indicative Rates |
|
| Indian Rupee |
As of Jan. end |
As of Dec. end |
Change |
Asian Indices |
As of
Jan. end |
As of Dec. end |
Change |
| USD/INR |
53.23 |
55 |
-3.22% |
BSE Sensex |
19,894.98 |
19,427 |
2.41% |
| EUR/INR |
72.33 |
72.38 |
-0.07% |
US Treasuries |
|
|
|
| JPY/INR |
0.5817 |
0.632 |
-7.96% |
1 year |
0.1345 |
0.1433 |
-6.14% |
| GBP/INR |
84.45 |
89.06 |
-5.18% |
5 years |
0.8798 |
0.7245 |
21.44% |
| CHF/INR |
58.48 |
59.93 |
-2.42% |
10 years |
1.9849 |
1.7565 |
13.00% |
| AUD/INR |
55.55 |
57 |
-2.54% |
Commodity |
|
|
|
| Global Indices |
|
|
|
Gold |
1,663 |
1,674.34 |
-0.68% |
| Dow Jones Index |
13,861 |
13,104 |
5.78% |
Silver |
31.41 |
30.31 |
3.63% |
| GOI Bonds |
|
|
|
Crude Oil |
117.13 |
111.11 |
5.42% |
| 1 year |
7.83 |
7.96 |
-1.63% |
USD/INR Forwards |
|
|
|
| 5 years |
7.95 |
8.025 |
-0.93% |
6 months (%) |
7.06% |
6.43% |
9.80% |
| 10 years |
7.91 |
8.05 |
-1.74% |
1 year (%) |
6.49% |
5.74% |
13.07% |
| 6 Months LIBOR |
|
|
|
|
|
|
|
| USD |
0.4684 |
0.5083 |
-7.85% |
|
|
|
|
|
|
|
| Source: Bloomberg/Reuters |
| |
Indian Macro-economic Indicators released (period 1 January 2013
to 30 January 2013) |
|
| Date |
Time |
Indicator |
Period |
Actual |
Forecast |
Prior |
| 2-Jan-2013 |
10:30 |
India Dec HSBC Markit Manufacturing PMI |
DEC |
54.70 |
|
54.20 |
| 4-Jan-2013 |
10:30 |
India Dec HSBC Markit
Services PMI |
DEC |
55.60 |
|
52.10 |
| 11-Jan-2013 |
11:00 |
Exports Y-O-Y |
DEC |
-1.9% |
|
-4.2% |
| 11-Jan-2013 |
11:00 |
Imports Y-O-Y |
DEC |
6.3% |
|
6.4% |
| 11-Jan-2013 |
11:00 |
Industrial Production Y-O-Y |
OCT |
-0.1% |
5.1% |
8.2% |
| 14-Jan-2013 |
11:00 |
CPI Y-O-Y |
DEC |
10.56% |
|
9.90% |
| 14-Jan-2013 |
11:00 |
WPI Y-O-Y |
DEC |
7.18% |
7.37% |
7.24% |
| 29-Jan-2013 |
11:00 |
Repo Rate |
|
7.75% |
7.75% |
8.00% |
| 31-Jan-2013 |
13:49 |
Fiscal Deficit (INR Crore) |
DEC |
-8,227 |
|
45,006 |
|
|
| Source: Bloomberg/Reuters |
|